The right data tool changes everything. It’s not just a program; it’s your workspace for exploring information, where efficiency and clarity are built in. A bad choice creates friction at every turn.
Let’s take a look at what’s available now—from platforms that build complex queries and visualize trends to tools that let teams ask questions in plain English. Knowing our options is the first step to working smarter.
SQL Tools That Improve Work for Analysts and Developers
We’ll examine the core functions, key features, and limitations of the five tools below.
dbForge SQL Tools by Devart
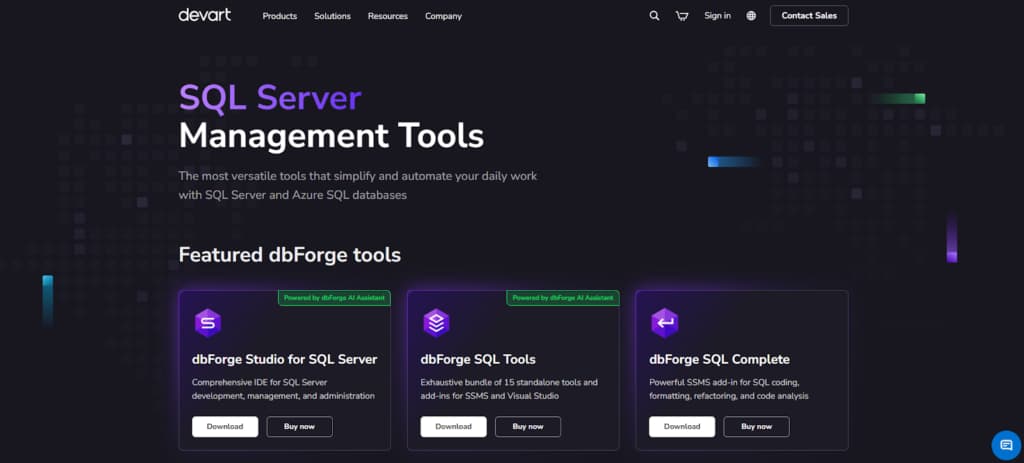
Devart’s dbForge SQL Tools are a specialized software suite for SQL Server and Azure SQL workflows, designed for analysts, developers, and DBAs. Its central component, dbForge Studio, is an IDE that provides a graphical interface for tasks like query writing, optimization, and script debugging.
The suite also includes 15 standalone applications and add-ins for SSMS and Visual Studio that handle data/schema comparison, documentation, test data creation, and DevOps automation.
dbForge SQL Complete, a key component, improves coding efficiency with smart completion, extensive formatting options, and syntax checking. Collaboration and automation are central, featuring integrated source control and CLI tools for streamlined deployments. Additional analysis capabilities include pivot tables, custom reports, and visualization tools. The suite provides a unified environment for the entire SQL development process.
Pros:
- Packed with features for the full SQL lifecycle
- Built specifically for SQL Server performance
- Backed by strong vendor support
Cons:
- Full power costs money (basic version is free)
- Designed for Windows; Mac/Linux setup is not straightforward
BlazeSQL
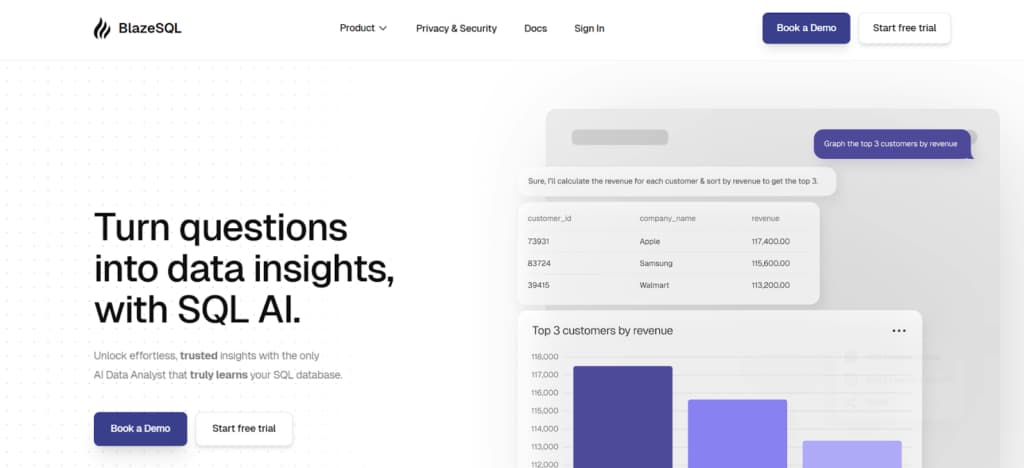
BlazeSQL is built around an AI natural language layer for working with data. Ask a question in plain words. It creates the SQL behind the scenes, runs it on the connected database, and returns the answer along with visuals like graphs or result tables.
You don’t need to know SQL or any programming. Teams across the company end up able to explore and understand their own data instead of depending on technical staff every time.
Pros:
- Queries in natural language (no SQL needed)
- AI instantly creates queries & visualizations
- Single-click dashboards & reporting
- Easy team sharing & export
- Supports major SQL databases
Cons:
- Paid subscription only (14-day trial)
- Works only with SQL databases
- No on-premise AI deployment
DBeaver
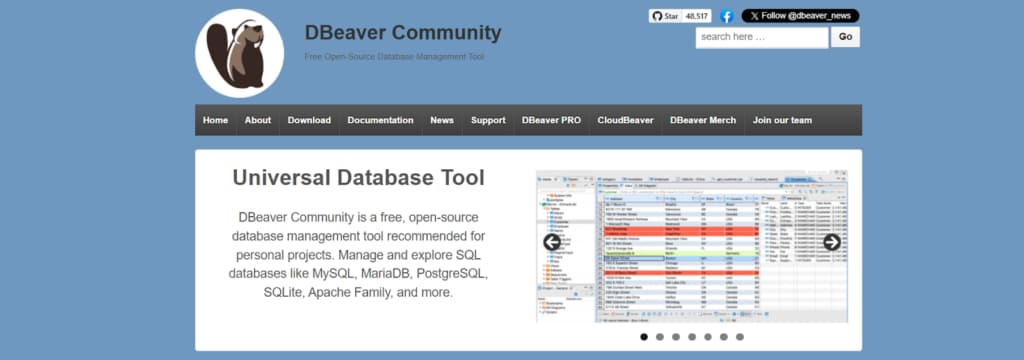
DBeaver is free open-source software designed as a universal database client for analysts and developers. It connects to numerous database management systems through one unified interface.
Professionals managing different database platforms or preferring open-source tools often select it for this reason. Core functionality includes executing queries, viewing and editing data, and handling database objects. Manual SQL query writing forms the central element of how the tool is used.
Pros:
- Universal Database Support: Connects to a vast array of database types, including MySQL, PostgreSQL, Oracle, SQL Server, SQLite, and many others.
- Free and Open-Source: Available at no cost with its source code accessible, allowing for community inspection and contribution.
- Active Development: Benefits from regular updates, improvements, and fixes driven by an active community and developer team.
Cons:
- Manual SQL Requirement: Lacks AI-powered code generation; users must write and understand SQL queries to interact with data.
- Basic Data Visualization: Offers limited built-in features for creating advanced charts, graphs, or dashboards directly from query results.
- Complex Interface: The interface can appear cluttered or less intuitive, especially for new users trying to work through its extensive feature set.
Power BI
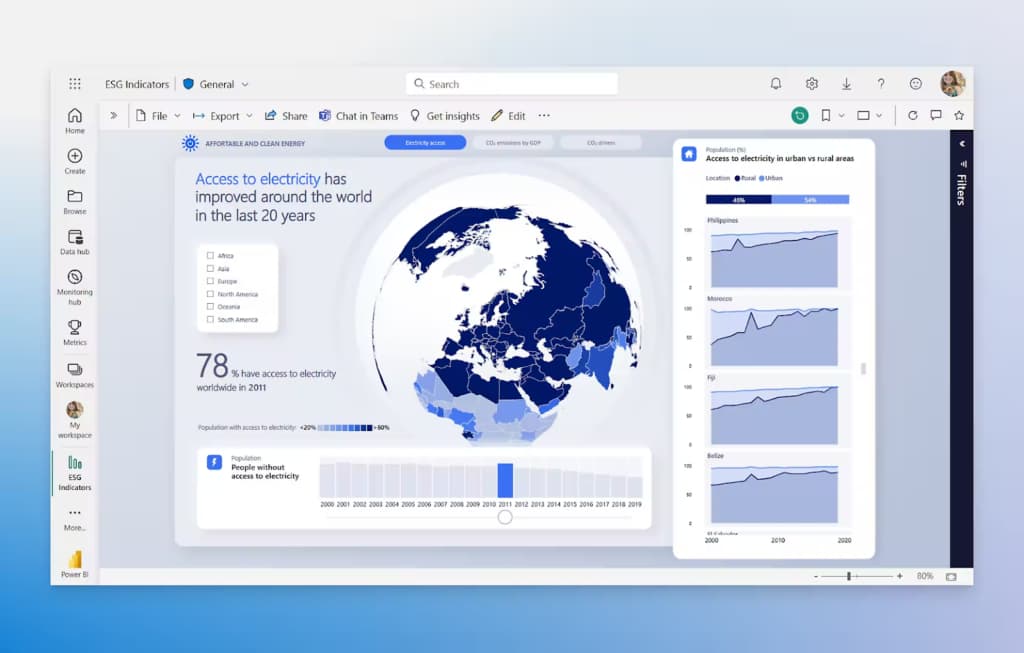
Power BI is Microsoft’s business analytics and data visualization platform. It handles the full process: connecting to data sources, transforming and modeling data, then building interactive reports and dashboards. It integrates well with Azure, Excel, Office 365, and Teams. Organizations already using those Microsoft products usually find that it fits easily.
The platform supports enterprise-scale business intelligence with features for large datasets, security, and sharing. It has many features, so learning it fully takes time and training to use effectively.
Pros:
- Extensive data source integration (SQL, CSV, Excel, cloud services)
- Advanced interactive visualizations, reports & professional dashboards
- Deep native integration with Microsoft ecosystem (Azure, Office 365, Teams)
- Strong governed collaboration, sharing & team deployment features
Cons:
- Steep learning curve, especially for non-technical users
- Many advanced features locked behind Premium / PPU licenses
- Performance can degrade with very large datasets (needs optimized modeling)
Tableau

Tableau specializes in data visualization and business intelligence. The platform facilitates data connection, analysis, and the development of interactive dashboards. Its key differentiator is the ability to convert complex data into accessible visual stories, more than its SQL query support.
The intuitive, drag-and-drop interface lowers the barrier to entry for business users, though achieving proficiency with advanced tools demands time. Tableau’s optimal use case is the visual communication of insights to non-technical decision-makers, not complex data transformation workflows.
Pros:
- Industry-leading interactive & publication-quality visualizations
- Intuitive drag-and-drop interface – great for non-technical users
- Broad connectivity (most databases, cloud apps, files)
- Strong community, resources & marketplace
Cons:
- High licensing cost, especially at scale
- Steep learning curve for advanced calculations & optimization
- Weaker native data preparation → often needs external ETL
Why Your Choice of SQL Tool Matters
This decision affects daily performance, error frequency, and team operations. Good tools eliminate manual busywork. Automatic formatting, code completion, and visual schema views are standard. Poor tools leave these tasks to the user. The resulting time difference accumulates noticeably.
Mistakes are common. Reliable tools catch them during writing with validation, error markers, and query efficiency checks. Basic tools miss these opportunities. Issues are discovered only after running the code, increasing the fix time.
Without collaboration support, sharing becomes disorganized. Files are exchanged manually. Change tracking is unreliable. Integrated tools maintain version history and prevent conflicts over which copy is current.
The tool should fit the work type. Exploration-focused users need one set of features. Development-focused users need another. A poor fit leads to repeated workarounds. Proper alignment provides the necessary functions directly.
Basic tools suffice for a limited scope, but limit progress when demands increase. Tools built to handle growth support evolving requirements without disruption.
The appropriate SQL tool minimizes obstacles in the workflow. An inappropriate one adds consistent friction. The outcome affects how effectively data is processed and utilized.
Conclusion
The right data tool aligns closely with key objectives and the environment. Categories cover development tools for targeted systems, multi-platform clients, complete BI systems for integration and reporting, and visualization platforms for data stories. There is no universal option.
Choose based on exact needs: performance, team skills, integration, or presentation goals. Correct matching boosts individual output and better data-driven decisions.