The JavaScript charting library market has plenty of choices, but teams still frequently pick ones that don’t quite fit. The issue isn’t usually the developers—it’s how the libraries are built.
You’ll often have to compromise: either fast rendering that’s painful to integrate, or smooth framework support that slows down with bigger datasets. We cut through the noise and ranked the nine libraries that actually balance raw performance with easy integration.
We tested them on real-world criteria: handling large-scale real-time data, customization options, framework compatibility, production stability, and accessibility. The gap between promises and reality is wide—some shine with massive datasets but stumble on modern frameworks, while others feel perfect in React until your data grows.
SciChart
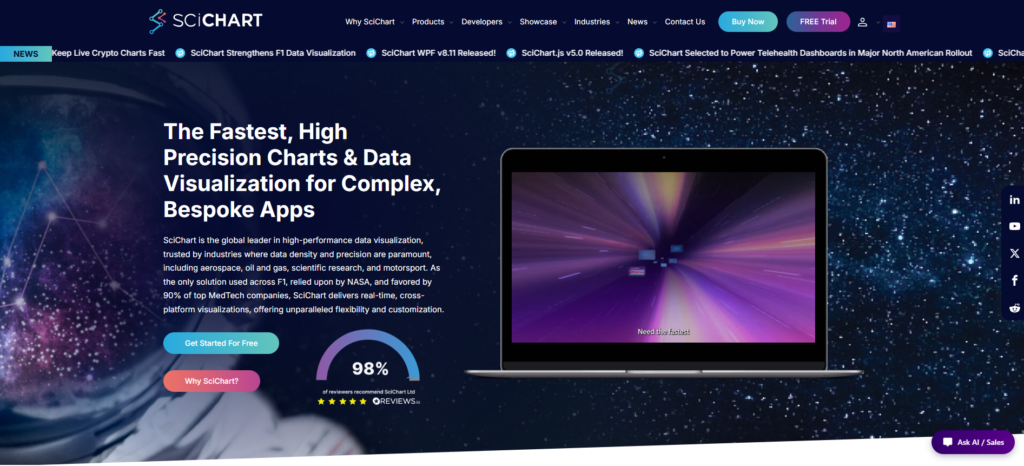
SciChart first appeared in 2012 and was built to solve a common problem: most charting libraries begin to struggle as datasets grow larger. Its proprietary Vx™ GPU-accelerated engine offloads rendering work to the graphics card, delivering smooth performance with hundreds of millions of datapoints directly in the browser.
Beyond speed, SciChart offers one of the most comprehensive visualization toolkits on the market. Developers can build everything from traditional 2D charts to 3D visualizations, heatmaps, gauges, geo maps, and polar charts using a highly customizable API.
The platform supports JavaScript, React, WPF, iOS, and Android, making it a strong choice for financial software, scientific applications, industrial monitoring systems, and analytics platforms that need consistent rendering across web and native environments.
Strengths:
- Renders hundreds of millions of datapoints with GPU acceleration.
- Extensive charting capabilities, including 2D, 3D, heatmaps, gauges, and geo maps.
- Highly flexible API with deep customization options.
- Trusted by developers, with nearly 500 five-star reviews.
- Strong documentation, 170+ demos, and a built-in AI assistant.
| Attribute | Value |
| Founded | 2012 |
| Best For | Real-time analytics at extreme scale |
| Rendering Engine | Vx™ GPU-accelerated |
| Platform Coverage | JavaScript, React, WPF, iOS, Android |
Highcharts
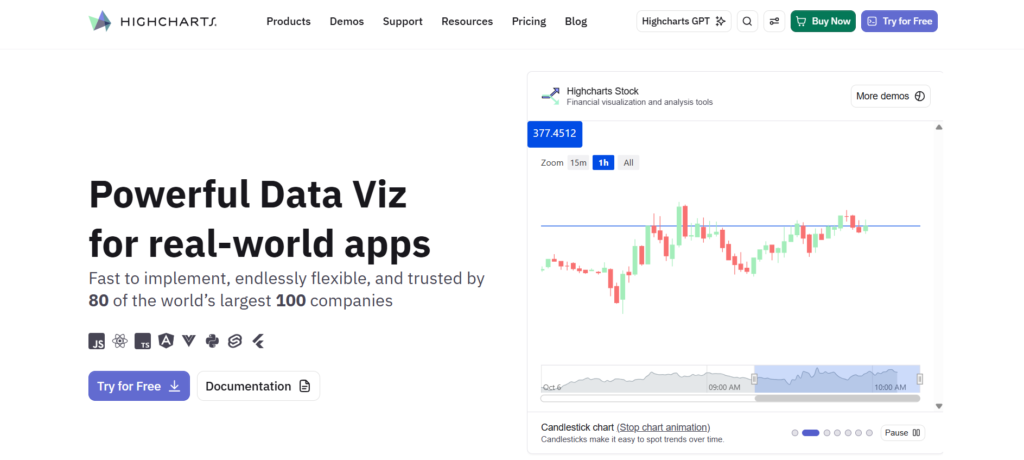
What sets Highcharts apart is how seriously it takes accessibility. It ships with WCAG-compliant charts and screen reader navigation built in — essential for government and regulated environments.
The modular structure is another big plus. It includes separate modules for Core, Stock, Maps, Gantt, Grid, and Dashboards. This lets teams keep bundles small while scaling from basic charts to advanced real-time financial dashboards.
Developers appreciate the smooth framework integration with React, Angular, and Vue. You get idiomatic components instead of fragile wrappers. On top of that, enterprise support offers proper SLAs and dedicated technical contacts.
| Attribute | Value |
| Best For | Accessible, enterprise-grade dashboards |
| Module Range | Core, Stock, Maps, Gantt, Grid, Dashboards |
| Framework Support | React, Angular, Vue (official wrappers) |
| Notable Strength | WCAG-compliant accessibility built-in |
Plotly
Plotly has been around since 2013. It strikes a nice balance—giving developers the tools they need to move fast while offering teams the deployment backbone required to scale properly.
At its core, you’ve got the open-source Plotly.js library with over 70 chart types. Whether you need basic bars or advanced 3D and scientific graphs, it’s all there. Then there’s Dash, which makes it straightforward to build full-featured analytical web applications in pure Python, R, or Julia, without ever touching JavaScript.
Here’s what makes it especially useful:
- Goes well beyond simple chart rendering.
- Plotly Cloud handles hosting, sharing, and team collaboration.
- Enterprise-grade infrastructure without heavy DevOps overhead.
| Attribute | Value |
| Founded | 2013 |
| Chart Types | 70+ (including 3D, scientific) |
| Best For | Teams needing charting + framework + hosting |
| Deployment | Self-hosted or Plotly Cloud |
Apache ECharts
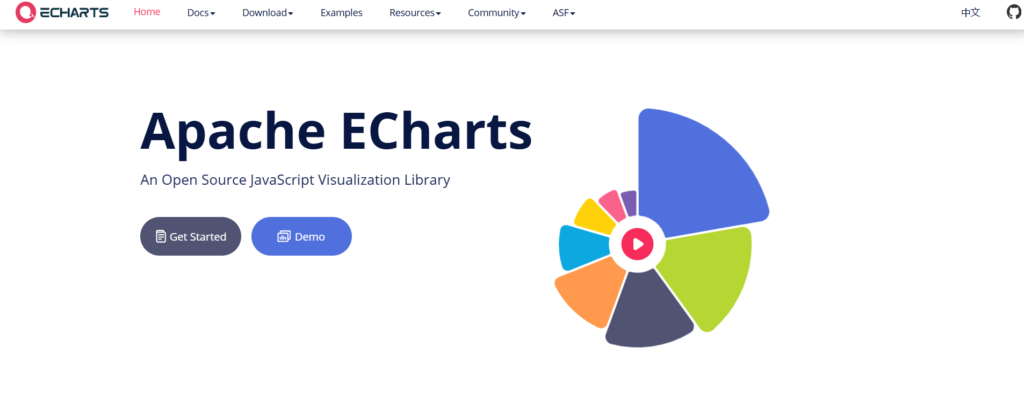
Apache ECharts started back in 2012 and quickly earned its spot under the Apache Software Foundation. The main reason? It gives developers real freedom while delivering the kind of performance you need in actual production environments.
The library includes more than 20 chart types and uses progressive rendering. That means your dashboards stay smooth and responsive, even when users are exploring massive datasets that would slow down other tools. You can also switch between Canvas and SVG modes depending on whether you need more speed or better scalability.
What really makes ECharts stand out is its ability to handle large datasets efficiently. There’s no proprietary licensing or vendor lock-in to worry about. Plus, its clean declarative API keeps your code simple, and the active Apache community keeps things moving with regular updates and fixes.
| Attribute | Value |
| Founded | 2012 |
| Governance | Apache Software Foundation |
| Chart Types | 20+ with progressive rendering |
| Best For | High-volume open-source analytics platforms |
Recharts
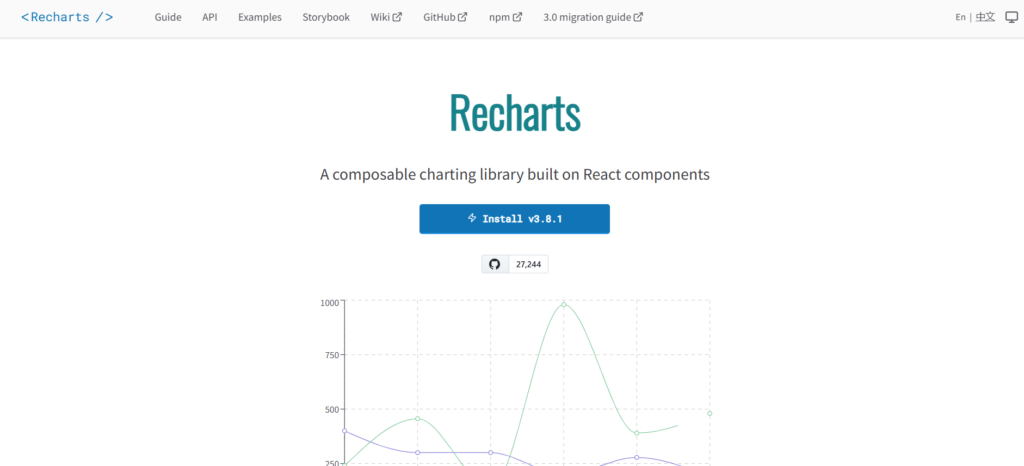
Recharts came out in 2015 and was built specifically for React teams. It treats charts as composable JSX components, so axes, tooltips, and legends all become reusable pieces you can drop in naturally.
You skip the usual imperative D3 manipulation. Instead, you compose everything declaratively—add a <LineChart>, nest the elements you need, pass your data, and it just works.
A few things that make it stand out:
- Built on SVG with minimal D3 dependencies for smooth animations and responsive scaling.
- Slots directly into existing React workflows with no adapter layers.
- Keeps your unidirectional data flow intact.
- Great for typical business use cases (10K–50K records).
It shines for quick prototyping and internal dashboards. While it’s not ideal for massive datasets, the developer experience more than makes up for it in most real-world scenarios.
| Attribute | Value |
| Founded | 2015 |
| Rendering | SVG with D3 submodules |
| Framework | React-only |
| Best For | Rapid dashboard prototyping in React apps |
ApexCharts.js
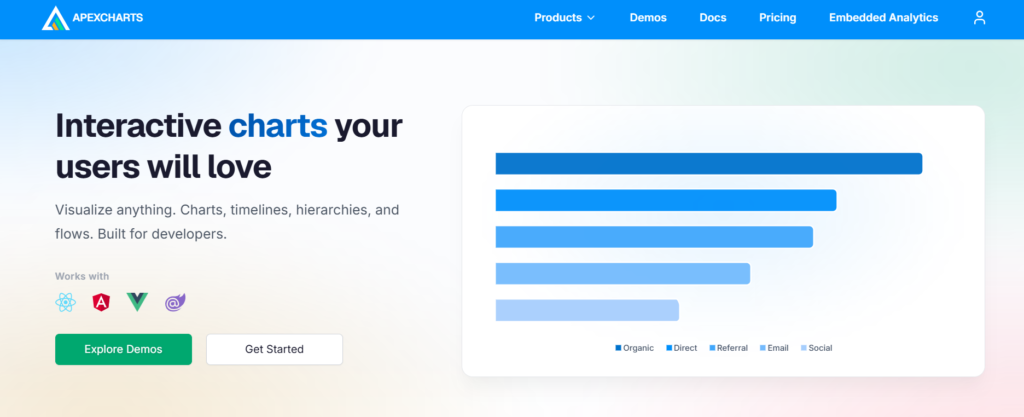
Founded in 2018, ApexCharts.js targets developers who need production-ready charts fast. The library includes 20+ chart types with built-in zooming and panning—no plugin hunting required. You import, configure in minutes, and deploy interactive dashboards that actually respond to user input without custom event handlers.
Framework integration is seamless. Support for React, Angular, Vue, and Blazor means your team doesn’t wrestle with wrapper libraries or compatibility patches.
The developer-friendly API with extensive documentation reduces onboarding friction—junior developers ship charts on day one, senior developers appreciate the clean abstraction that doesn’t lock them out of customization when edge cases emerge.
| Attribute | Value |
| Founded | 2018 |
| Framework Support | React, Angular, Vue, Blazor |
| Chart Types | 20+ with interactive controls |
| Best For | Rapid dashboard prototyping and production deployment |
amCharts
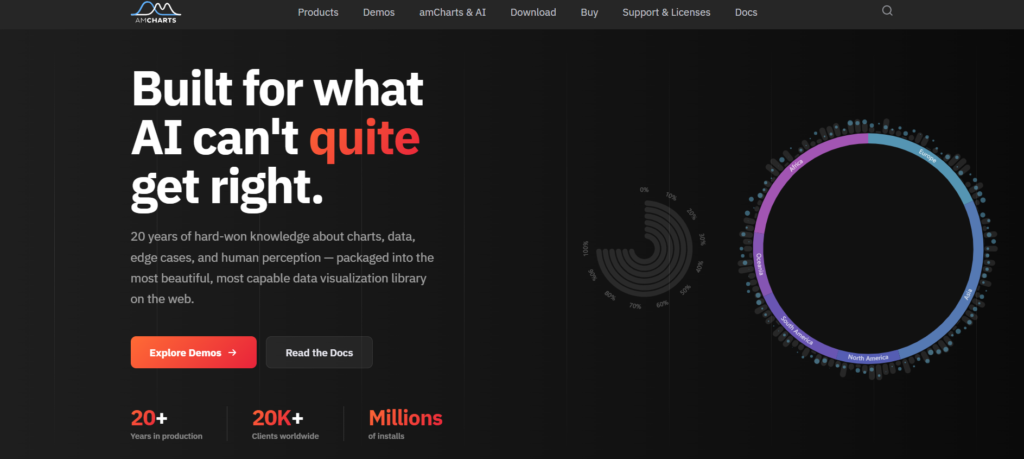
Since 2006, amCharts has built up almost 20 years of expertise in data charts. It works well for platforms that need lots of options without slowing down.
You get over 60 chart types included, covering financial candlesticks, Gantt timelines, and more. No extra modules required. The Canvas rendering keeps everything responsive with big datasets, even on average computers.
It’s used by more than 20,000 companies globally. Built-in accessibility features like keyboard navigation, screen reader support, and WCAG color palettes help enterprise teams meet regulations. The API is straightforward but still gives you good control.
| Attribute | Value |
| Founded | 2006 |
| Chart Types | 60+ (financial, Gantt, maps, standard) |
| Rendering Engine | Canvas-based for high performance |
| Best For | Teams needing diverse chart types with accessibility compliance |
ZingChart
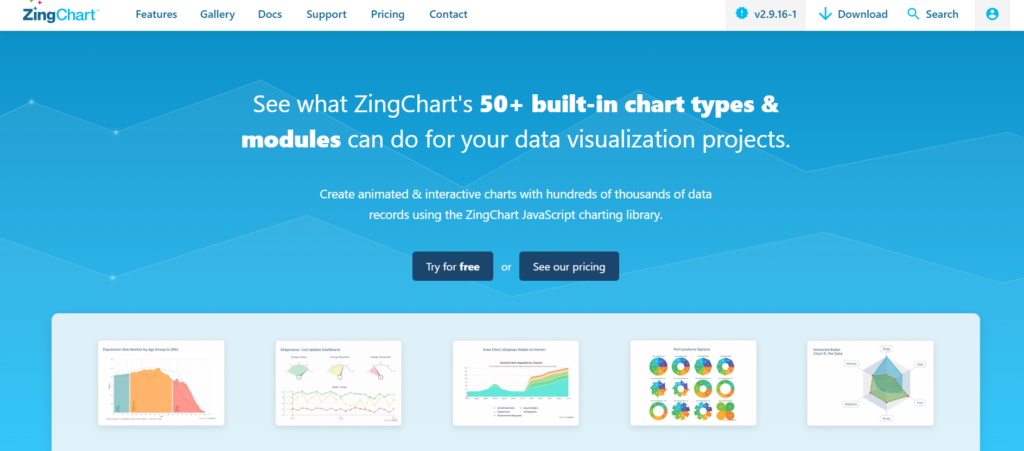
Since 2009, ZingChart has focused on delivering more than 50 chart types in a pure JavaScript library with zero dependencies. No framework wrappers needed. This makes it ideal for teams who want reliable performance without dealing with breaking npm updates.
Its sweet spot sits between 10k and 100k data points. These sizes often overwhelm simpler SVG libraries, but don’t require full GPU acceleration.
ZingChart handles this range smoothly thanks to its hybrid rendering engine. It’s especially useful for:
- Building financial dashboards
- Creating real-time monitoring interfaces
- Developing operational analytics platforms
You get solid speed without the usual overhead from third-party integrations.
| Attribute | Value |
| Founded | 2009 |
| Chart Types | 50+ built-in types and modules |
| Dependencies | Zero — pure JavaScript |
| Best For | 10K–100K record datasets without framework lock-in |
D3 by Observable
D3 has been a staple since 2011, and it continues to stand out for teams that want complete creative control over their charts and interactions.
Most libraries give you ready-made components. D3 takes a different approach: it’s fully open-source and lets you bind data directly to the DOM, then shape it with SVG, Canvas, or HTML. It’s definitely harder to learn. That said, this low-level power becomes invaluable when off-the-shelf solutions fall short.
A few areas where D3 particularly stands out:
- Building custom network graphs with their own physics
- Creating animated transitions that sync perfectly with real-time data
- Developing interactive maps with specialized domain overlays
Over the years, it’s become the foundation for dashboards and rich graphics across journalism, finance, and scientific fields. The upfront investment in learning it is real, but the payoff is huge — every visualization can be tailored exactly to your users’ needs.
| Attribute | Value |
| Founded | 2011 |
| License | Open-source (BSD) |
| Best For | Custom, bespoke visualizations requiring full DOM control |
| Framework Support | Framework-agnostic (integrates with React, Vue, Angular via wrappers) |
Frequently Asked Questions
Q: How much do JavaScript charting libraries cost in 2026?
A: Prices vary a lot. Free open-source options exist, while paid ones range from $99 to $1,500 per developer per year. Enterprise packages with priority support can go above $5,000 annually. Most offer trials or limited free tiers.
Q: Can they handle real-time data?
A: Most support real-time updates, but performance differs significantly. Canvas/GPU libraries shine with 100k+ points at smooth 60 FPS, while SVG ones usually start lagging around 10,000 points. Check real benchmarks for your use case.
Q: Do they integrate with React, Angular, and Vue?
A: Yes — framework support is standard now. You’ll get official components for the big three, though some libraries remain vanilla JS. Always double-check the integration guides.
Q: Are the charts accessible?
A: The top libraries offer good WCAG 2.1 compliance, including screen reader support and ARIA attributes. Many simpler ones still lack proper accessibility features. Prioritize vendors that document their testing if this matters to you.
Q: How long does it take to learn?
A: Simple charts take under an hour. Complex dashboards usually need 2–5 days. Strong documentation helps a lot.
Conclusion
Building analytics platforms requires charting libraries that don’t force you to pick between speed and ease of use. While most promise both, the nine we ranked actually deliver.
Real-time performance at scale, chart variety, framework support, production reliability, and accessibility are what separate the strong options from the rest.
The best library for you depends on balancing your performance needs, customization requirements, and framework fit. This guide makes that choice clearer.
Go ahead and benchmark the top three against your heaviest data. Test how they work with your stack and check their enterprise docs. When you pick the right one, your data becomes actionable without rebuilding everything around its limitations.